At OmniTI, we like to take on complex problems and big challenges. Sometimes we need a little help thinking through these problems, and sometimes that help can come in the form of a beer. Whether it's the drink itself or the collaborative nature of sharing a beverage with our coworkers, if there's a problem that has been perplexing our developers all day, the solution will often become obvious as soon as the first sip of beer hits our lips at 6:00.
Like the rest of our work, we take our beer seriously, and in order to serve our after-hours drinking needs, the kitchen is equipped with a redundant kegerator setup, which provides load balancing and fault tolerance. Initially, in order to show what was on tap, we had a 7" Android tablet showing a web interface in full-screen mode.
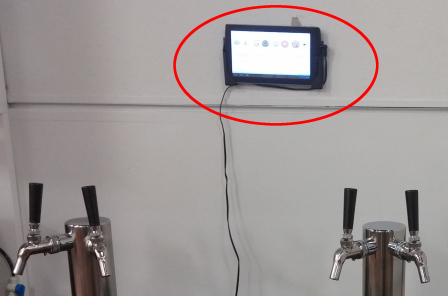
The original display.
This did its job well enough, but like anything else that's mission-critical, it needed proper metrics and monitoring. With a couple flow meters, we could measure how much beer is being dispensed from each of the taps, and use that to estimate how much is left in the keg. This would help us to know when we need to buy more beer, but more importantly, it would look awesome. Also, I wanted an excuse to play with electronics.
Initial planning
The first step was to decide on the major parts of the system. I would need a controller board in order to hook everything up and run the code that reads input from the sensors. The Arduino IDE is a popular open-source platform for writing embedded code, and there are many controller boards that can run Arduino code. I ended up choosing the Teensy 2.0 due to its size and low price. While it isn't an official Arduino board, it is capable of running standard Arduino functions using the Teensyduino add-on.
Additionally, several other programs would be necessary: a listener program to communicate with the controller board, a display program to run the monitor, and a web API to store this information in a database.
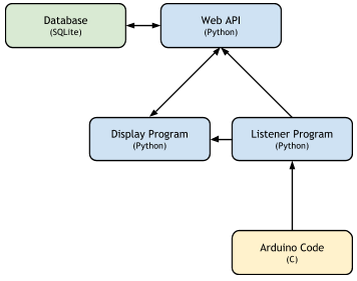
Software components
Software
Arduino Code
The Arduino code is the part of the program that reads input from the sensors and sends the data to a PC over a USB connection. I used Adafruit's Kegomatic code as a reference for writing this program.
When liquid is flowing through the flow meter, power to its pulse output wire switches on and off. Blowing air through the flow meter also triggers pulses, which allowed for testing without actually installing the meters. According to the specifications, each pulse indicates 2.25 mL of liquid passing through the meter. The Arduino code simply counts these on/off pulses, and then returns that count when asked.
The board is connected to a PC via a USB port, and waits to receive any input over the USB serial interface. Once it receives any input, it builds and returns a packet, and resets its pulse counters. The packet it sends starts with an 8-byte header containing the size of the packet, the number of taps, and the number of temperature sensors. The header is followed by an 8-byte integer for each of the values.
Since the USB module just sends the pulse count, rather than converting to ounces or liters, we can calibrate the flowmeters without having to reprogram the Teensy.
Listener Program
The listener program is a Python program that runs on a PC and communicates with the controller board. The Teensy is connected to the PC via USB, and the listener program uses pySerial to find and communicate with the Arduino program.
The listener program sends updates to the display program when it detects output from a flow meter, and updates the web API after output stops. It also periodically sends readings from the temperature sensors to the web API.
Display Program
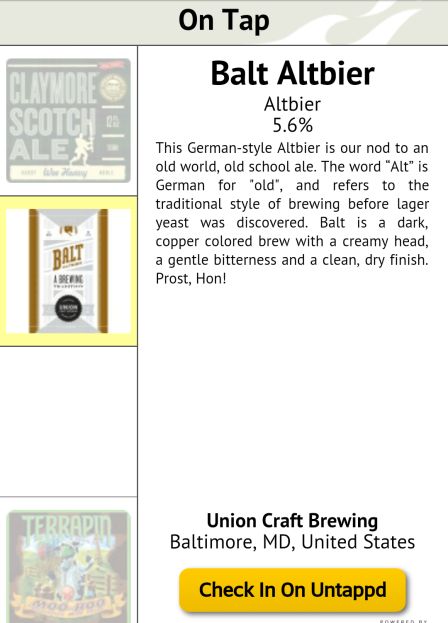
The display program is the part of the code that shows which beers are on tap, how much is remaining of each, and when each one is being poured. I wanted the display to update immediately when the taps were active, so a web interface would not be ideal here. Instead, the display is a desktop application written using Tkinter, the most popular GUI programming toolkit for Python.
The new display is also on a much larger monitor than the old Android display. With this additional space, I was able to add more information to the display, such as the beer style and description. Since the program is using the Untappd API for beer information, it was also simple to fetch any Untappd check-ins at OmniTI headquarters and display those on screen.
Web API
The beer list is tracked by a web application, which runs on an OmniOS server, and stores data using SQLite. The web application exposes the current beer list and keg status in JSON format. This endpoint is accessed by the display program to show which beer is on tap, and is also used by an IRC bot that sends out a message to an internal IRC channel when a keg is changed.
The web server also provides an admin interface, which uses OAuth 2.0 and Google's API to authenticate users, and allows the list of beers on tap to be updated.
Users can also pull up the mobile version of the website, which displays beer names and descriptions, and links directly to the beers on Untappd.
A screenshot of the mobile site.
Source Code
I've uploaded this code to GitHub and made it available for use under the MIT License. This was the first Arduino code I had written that's more complex than "Hello World", and it's definitely reinventing the wheel somewhat, but it was a good learning experience.
Hardware
Raspberry Pi
We needed a computer to hook up the flow meters and display. I decided that this would be perfect for a Raspberry Pi, especially since we already had a spare one in a box in the supply closet. I installed the Raspbian Linux distribution, and wrote a script to install all the prerequisites for the display and listener programs.
I also needed a new display. The old beer list was displayed on a 7" tablet, which was a bit too small, and only supported a resolution of 800x480. I was initially looking for something in the 10-12" range. A Tontec 10" LCD would have cost about $50 less, but would have required some assembly, and I was worried that it would still be too small.
I ended up ordering an Asus 21.5" monitor and I'm quite happy with it. It's bigger than we really need, but the larger size made it a lot easier to read, and gave us plenty of real-estate to play with without looking unreasonably huge.
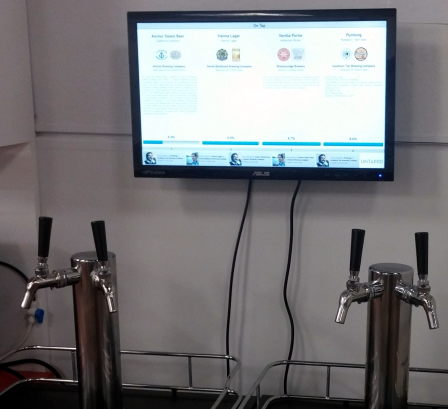
The new screen, prior to hooking up the flowmeters.
First prototype with single meter
After the initial planning, I wanted to create a small proof of concept, before investing into the full kit. I ordered the Teensy 2.0 controller board, a single flowmeter, and a temperature sensor, and hooked them up using a breadboard to write the first draft of the code.
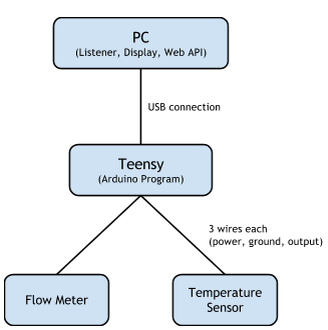
Components for initial prototype
"Practice Run"
After getting the controller program to work with the smaller prototype, I ordered the rest of the flow meters and some wire, and started putting things together. For this design, the Teensy sat directly on top of a Perma-Proto Breadboard. I connected each of the Teensy's inputs to the breadboard by soldering a pin between the Teensy and one of the rows on the breadboard. Then I soldered four 3-pin plug receptacles to the breadboard. These receptacles fit the plug that comes with the flow meter, and allowed me to connect and disconnect the flow meters without having to redo any wiring.
All of the connections worked, so I considered this to be a massive success, especially since I had never soldered anything before. However, there were a few problems with the design:
- I didn't measure beforehand, and the wires between the flow meters and the breadboard weren't long enough to reach from the kegs to a single breadboard.
- I hadn't considered where I was actually going to put the temperature sensors. With this design, I couldn't solder them directly to the breadboard. Adding more of the 3-pin plug receptacles might have been an option for this.
- We have two separate kegerators, and would have had to run nine wires into each of them - three for each of the flow meters, and three for the temperature sensor.
- The power and ground rails and the pre-connected rows of holes were convenient, but forced me to bunch all my wires very close together.
At this point, I thought it was better to scrap it and start over with a better plan, using what I had learned for the next iteration.
Final Design and Assembly
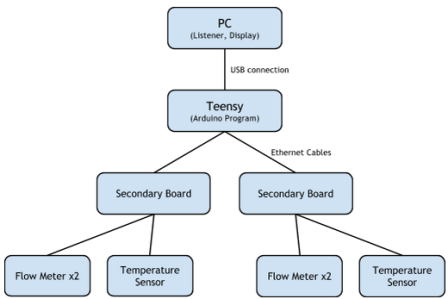
For the final product, I decided to put a small prototype board in each of the kegerators, and connect each of those to a main board with the Teensy. Each of the small boards have a temperature sensor, two ports for connecting flowmeters, and a RJ-45 jack. Ethernet cables were perfect for connecting these to the main board - they have 8 wires each, and we have plenty of them sitting around already. I ran power and ground on the first wire pair, and one signal on each of the other three pairs.
I tried to find out if there was a "correct" way to hook up components on a prototype board, and all the answers were essentially "whatever works is correct". Some instructions recommended using solder bridges to connect power and ground, but this seemed far too difficult. I found it was easier to strip two wires and run them across the length of the board, then connect power and ground to those. Each of the signal wires connected directly from the RJ-45 port.
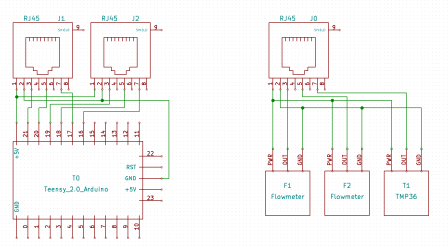
Basic circuit diagram for the main board (left) and the secondary board (right)
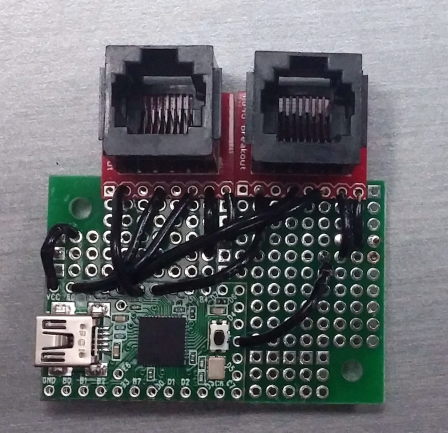
The main board.
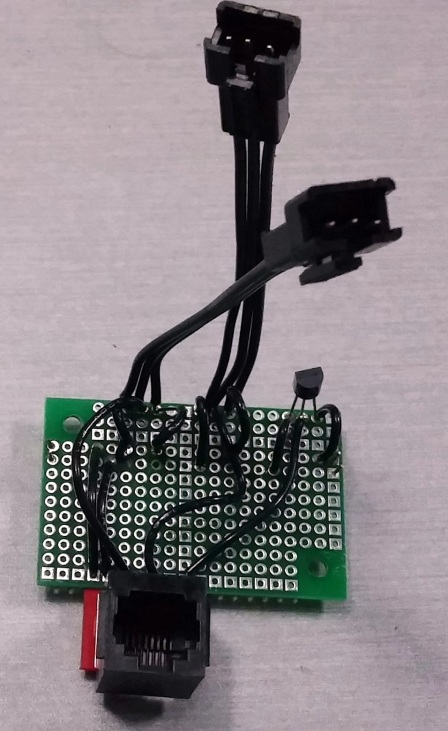
One of the secondary boards.
Instead of doing all the wiring by hand, another option would have been to get circuit boards printed through a service like OSH Park or ExpressPCB. This would have cost about $30 more. I still would have had to solder the components to these boards, but I would not have had to do all the manual wiring between these connections. If I ever do anything like this again, I will most likely use this option instead of using prototype boards and manual wiring.
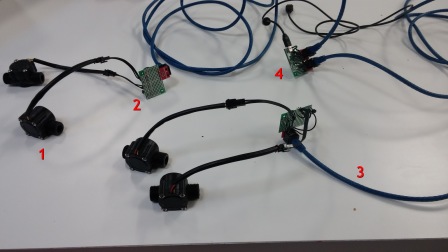
All the pieces ready to be installed. 1: Flow Meters, 2: Secondary Boards, 3: Ethernet Cables, 4: Main Board
Connecting to Hoses
Making the actual connections between the hoses and the flow meters ended up being more of a problem than I had initially anticipated. I needed to cut the existing beer hoses and attach connectors in order to hook up the flow meters, so for four taps, I needed eight connectors. Each flow meter has a 1/2" threaded connector on each end, and our hoses had an internal diameter of 3/16". The only adapters I could find to fit into a 3/16" hose would have required multiple connectors and cost at least $15 each. I ordered a pack of 1/4" hose barbs, hoping they would fit into the hose. Putting the end of the hose in hot water helped to stretch it a bit, and with enough force, I was able to get everything into place.
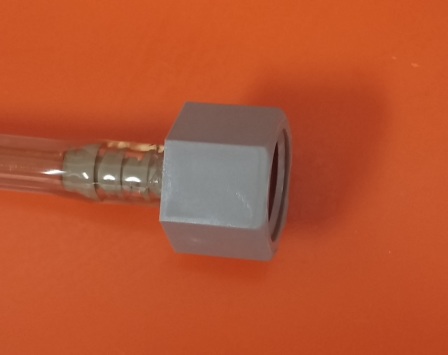
1/4" hose barb in a 3/16" hose.
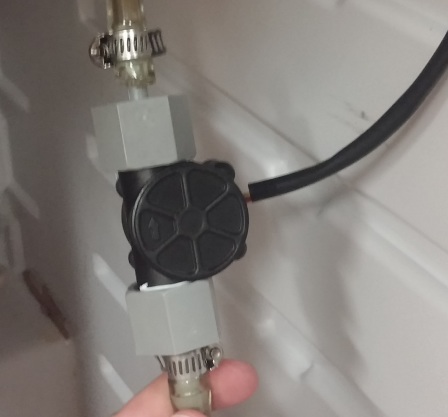
Hose barbs installed, hose clamps on, flowmeter connected and tightened.
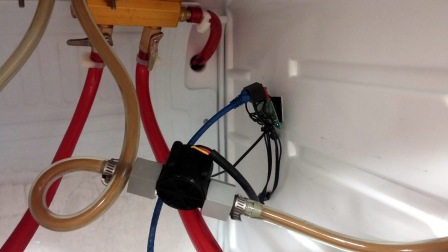
Flow meter installed in beer line, secondary board taped to side of kegerator
On my first try, the connectors were leaking. After using more teflon tape, tightening them more, and mopping beer off the floor, everything seemed okay.
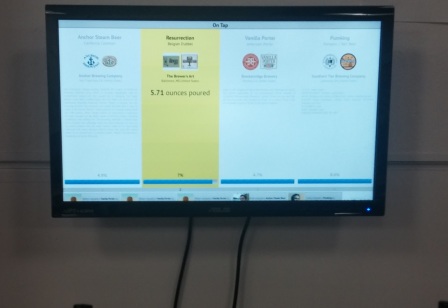
First working pour! (Old version of interface with formatting issues)
According to the specifications, each pulse is 2.25 mL. Since my code counts both the on and off pulses, it should actually be 1.125 mL per pulse. After converting to sensible and proper units, this is 0.9502 fluid scruples, or 0.0380 fluid ounces.
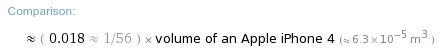
Because I know you were wondering.
Using this value, the program said we were pouring upwards of 30 ounces into a 12 ounce glass. While this would be nice, it seemed unlikely. I grabbed whatever we had nearby with unit markings and did some basic testing.
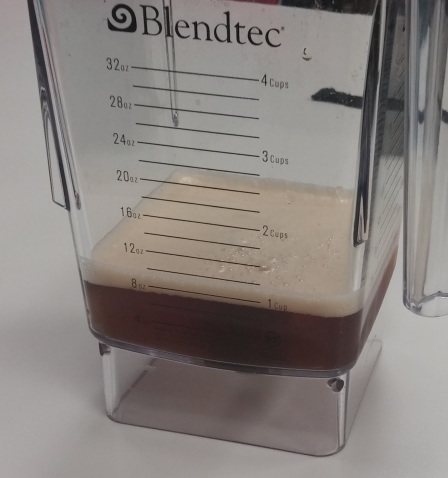
We're doing science here.
With the blender, I came up with a rough estimate of 0.02 ounces per pulse, but I wanted to be a bit more exact than that. I ordered a graduated cylinder, put on a snazzy lab coat, grabbed a clipboard, and did some more in-depth testing. The graduated cylinder showed different values for each tap, between 0.0127 and 0.0199 ounces per pulse. I made a small modification to the program to allow it to use a different value for each tap, and updated the configuration file with these new values.
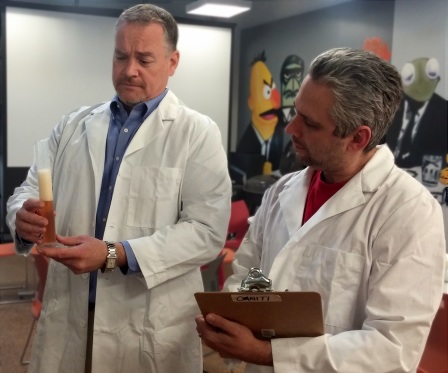
Later, I asked two of our top scientists to peer review my data. Initial results suggest that beer is tasty. Further research on this hypothesis is already underway.
Beer Metrics
The webserver's database keeps track of the amount we have left right now, but I also wanted to make sure we could trend our long-term consumption. To make this happen, the webserver also exposes a JSON endpoint with status information about the kegs. Circonus can access this data and create some useful graphs about our precious liquids.
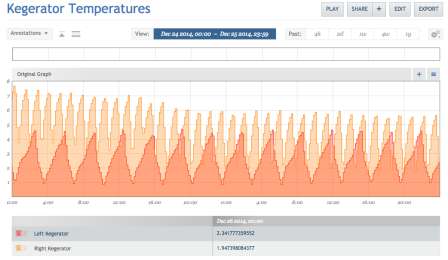
This graph shows the output from the temperature sensors. When everything is working correctly, the temperature goes up and down as the compressor switches off and on.
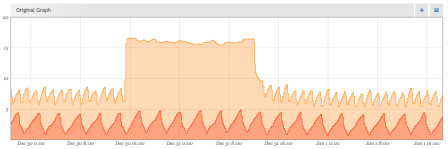
But if I don't close the door all the way and don't notice until the following morning, it gets a bit warmer. In the spirit of learning from my own mistakes, I've set up an email alert when the temperature stays too high for more than 30 minutes.
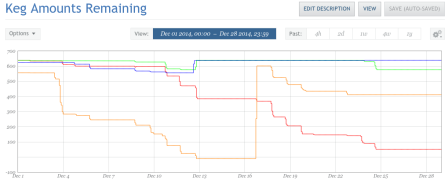
Another useful graph shows an estimate of the amount remaining in each keg. The orange line jumps back up to full in the middle, showing when the keg was replaced. Not all of the kegs were empty when the flow meters were installed, so we didn't have an accurate measurement of the amounts remaining in kegs 3 and 4 (the blue and green lines) until both were replaced on December 13th.
Using these metrics, we could also set up an alert if beer is poured before the end of business hours. This could send out a simple email alert, or (preferably) set off an elaborate shame siren in order to properly admonish the offending party.
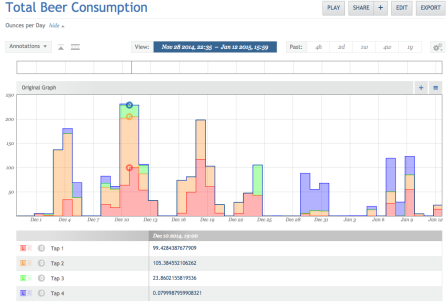
This is a stacked graph showing total beer consumption. Each individual tap is shown in a different color, and the combined height of the bars shows the total flow of all four taps combined. The minimum resolution is set to one day, which means that the bars show the total for each day. This gets rid of the large blank spaces that would otherwise show up in the non-drinking hours of every day.
Final Thoughts
This certainly isn't the most useful tool ever built, but I had fun building it and I learned a lot about things I don't normally have a chance to work with. It looks great and I'm incredibly happy with the results, but my beer robot can never be as good as this one.